
Data Intelligence and Dashboard Design Services
We draw from our extensive real-world experience to develop, test, and deploy data intelligence models, machine learning-driven analyses, and interactive web-based dashboards.
Here at Chestnut Hill Analytics, our approach to data intelligence transforms raw data into actionable insights by combining data engineering, analytics, and machine learning to reveal patterns, trends, and causal relationships.
For businesses, this means sharper decision-making by identifying profitable customer segments, forecasting demand, optimizing supply chains, and measuring marketing ROI. Non-profit organizations benefit by using intelligence to target services more effectively, demonstrate program impact to funders, and allocate limited resources where they generate the greatest social return. Scientific researchers gain from data intelligence, as we use advanced analytics to uncover subtle signals, quantify uncertainty, and accelerate discovery across large, complex datasets.
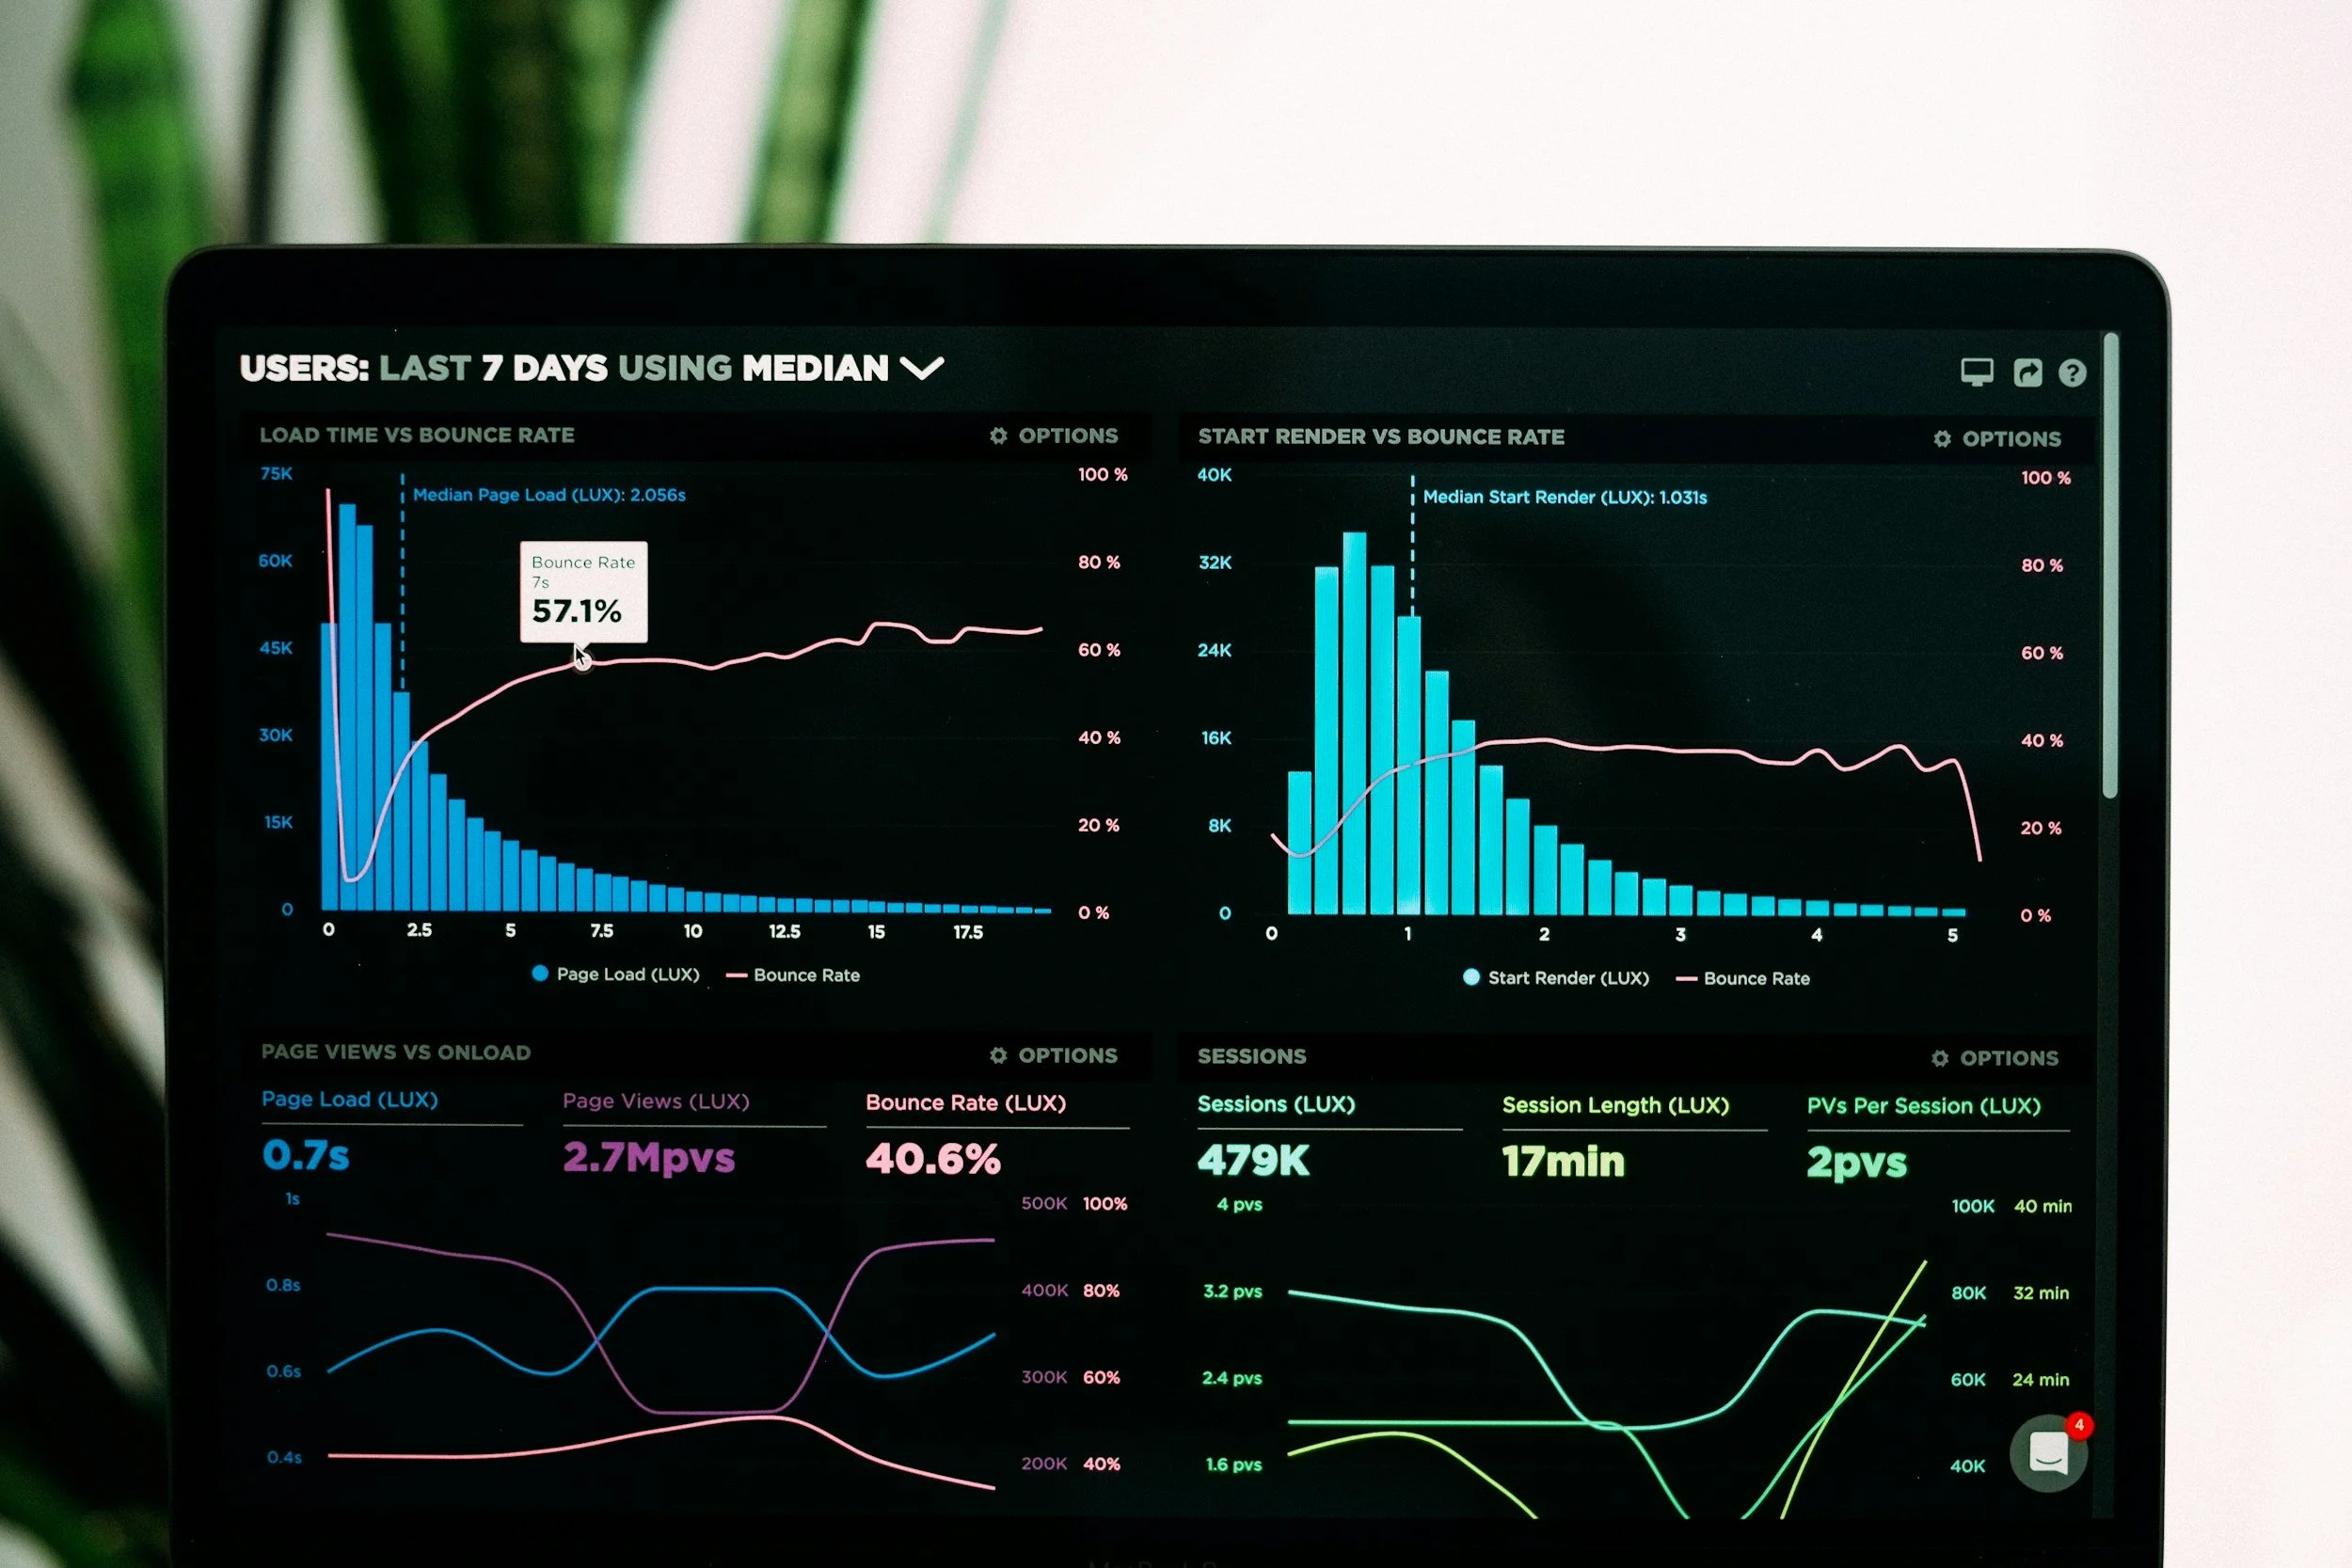
Interactive data dashboards make these insights accessible and operational by presenting key metrics in real time with visual clarity and interactivity. For managers and program directors, dashboards consolidate multiple data sources into one view, enabling rapid exploration through filters, drill-downs, and scenario comparisons so teams can respond to emerging opportunities or risks. In the nonprofit context, dashboards facilitate transparent reporting to stakeholders, support evidence-based program adjustments, and simplify compliance and grant reporting. Researchers use interactive dashboards to monitor epidemiological trends, visualize the status of observational and/or experimental studies, visualize multi-dimensional results, and share results from analyses with collaborators for faster feedback cycles.
Beyond visibility, the combination of data intelligence and interactive dashboards supports a culture of continuous improvement. Embedding dashboards into daily workflows encourages data-driven habits—regularly checking KPIs, setting alerts for anomalies, and iterating on interventions based on measured outcomes. This feedback loop reduces response time, lowers operational costs, and improves program and research efficacy. When designed with clear objectives, robust data governance, and user-centered visuals, data intelligence plus interactive dashboards become strategic assets that align stakeholders, unlock latent value, and sustain measurable progress.
Drawing on our team at Chestnut Hill Analytics’ breadth of expertise in multiple data intelligence and dashboard-creation software platforms, our professionals leverage a variety of data science, visualization and machine learning tools to enhance your business, organization or scientific research studies.

How can data intelligence and dashboard design help my organization?
Apply data intelligence models and dashboards in numerous use cases
Enhance understanding of customers, donors and research participants
Develop and manage data-driven dashboards for executives, internal teams and external stakeholders